Why Power BI for your Visualization needs
Power BI is recognized as a leader among analytics and BI platforms by the major research companies (Gartner, Forrester, IDC, etc.). Best for data analysis for non-technical business users. Power BI provides agile inquiry and analysis without the need for specialized technical support
Share


Modern businesses are built on the wealth of data and how they make use of it. As more and more companies understand the importance of data, they are generating an increasing amount of data each month. These incremental accumulations of data mean nothing unless it is not put to proper use and this is where a data visualization tool like Power BI comes into the picture.
With Power BI businesses can convert their raw data into actionable insights and reports that drive growth with the help of AI. According to a report published by Microsoft in 2016, Power BI had an active subscriber count of 5 million, and we believe that number could be doubled by now.
Let’s now dwell on the important aspects that make Power BI the ultimate choice for visualization needs.
Consolidate data from multiple sources
The real strength of Power BI lies in its integration with multiple data sources. Though it is a Microsoft product, one can easily connect with various third-party data sources and import the data into Power BI for better visualization and reporting needs. Some of the data sources supported by Power BI are SQL server, JSON, Oracle, IBM DB2, PostgreSQL, XML, etc.
Minimal investment
Unlike traditional software, Power BI is a subscription-based model. Companies can get started either free or with minimal monthly costs depending on the number of users and features required. The basic plan starts at $9.99 per user per month. There is no need to invest a huge capital upfront to start with.
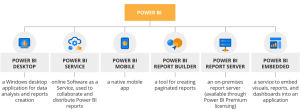
Multiple platforms support
Though Power BI is a heavy software offering a rich set of functionalities, it can be accessed across platforms and devices. They have native apps that work seamlessly for Android, iOS and Windows devices. You can create and view reports and dashboards even on your mobile device on the go. This is what makes Power BI a preferred choice for CEOs.
Sharing of dashboards
One of the intricate aspects of Power BI is the designer’s ability to create and share dashboards with ease. You can create a customized dashboard based on the specific dataset and that dashboard can be shared with anyone in your organization. Once the dashboard is created you can share it as a link and anyone with the link can open the dashboard with various access permissions that you have set. It is not only a business intelligence tool but also helps in team collaboration.
Real-time information
Power BI has the ability to provide real-time data streamed in from multiple sources. Dashboards reflect the updated real-time data as and when new data is streamed in. Monitoring and processing real-time data is critical for businesses that focus on time-sensitive information. You have the control to set how frequently the data is streamed in real-time. It can be set to either hourly or daily based on your business requirements.
Intuitive drag and drop report builder
Power BI provides an easy-to-use drag and drop dashboard builder that eases the learning curve for new users. Anyone with minimal knowledge of the internet can easily get started with Power BI to generate complex reports and visualizations. Everything can be achieved with a visual drag and drop builder with minimal or no coding skills.
Secure access
Sharing dashboards is one of the key aspects of Microsoft Power BI but it is further enhanced due to security features that are in-built. When you create a report, you have the full flexibility to set row-level access for each dataset. RLS or Row Level Access facility enables report creators to restrict data access based on user type. This prevents users from viewing data that they are not supposed to look at. You can allow only a specific set of users to view segments of the report.
Cortana integration
As mentioned earlier, Power BI has powerful native apps for mobile devices. On top of it, it easily integrates with Microsoft Cortona. Cortona is a voice-based digital assistant. With Cortona, users can easily ask questions in English language and Power BI will display the appropriate reports and dashboards.
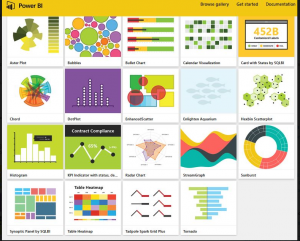
Built-in templates for data visualization
Power BI comes with 100s of readymade built-in templates that anyone can use to build their reports and other types of visualization. This not only saves time but also improves the productivity of report developers. It also comes with Machine learning capabilities that make it easier to report huge volumes of data.
Easy to write queries for complex reports
Power BI supports complicated queries for generating reports but at the same time, it also supports natural language. There is no query knowledge required to get started with Power BI. You can simply ask questions in natural language and it will generate reports based on the same. For example, a simple question like
“What is the total sales amount by country?”
Power BI will generate a visualization showing the total sales amount for each country of your business.
Growing support communities
Power BI is the fastest growing BI tool for more than a decade now. Online communities are buzzing with Power BI enthusiasts that help each other answering questions about Power BI.
The Bottom Line
As one of the leading data visualization tools on the market, Power BI allows you to leverage AI to deliver value to your business. With Power BI, you can easily visualize and analyze data across your entire business and gain deep insights into your operations and performance.
TAFF has been helping businesses worldwide to make sense of their data using Power BI. We have experienced professionals who can help businesses to get started with Power BI and design complicated reports which drives business growth.
Share